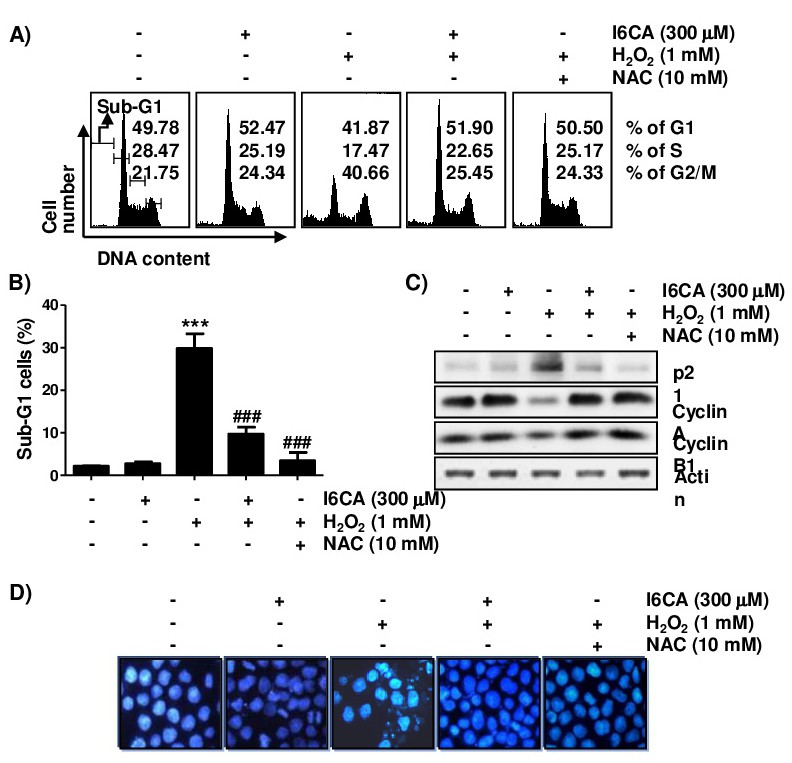
Fig. 3. Inhibitory effect of I6CA on H2O2-induced cell cycle arrest in V79-4 cells. The cells were pretreated with or without 300 μM I6CA or 10 mM NAC for 1 h before treatment with 1 mM H2O2 for 24 h. (A) The cells were stained with PI solution for flow cytometry analysis. The average percentages of cells in each phase of the cell cycle, except for the cells in the sub-G1 phase, are displayed. (B) Sub-G1% was calculated as the number of cells in the sub-G1 phase relative to the number of total cells. The results are expressed as the mean ± SD obtained from three independent experiments (***p<0.001 compared with the control group; ###p<0.001 compared with the H2O2-treated group). (C) Total cell lysates were prepared, and equal amounts of proteins were subjected to Western blot analysis of the listed proteins. Actin was used as an internal control, and the proteins were visualized using an ECL detection system. (D) The cells were stained with DAPI solution, and the stained nuclei were observed using a fluorescence microscope (original magnification, 200×). Each image is representative of at least three independent experiments.